By
By 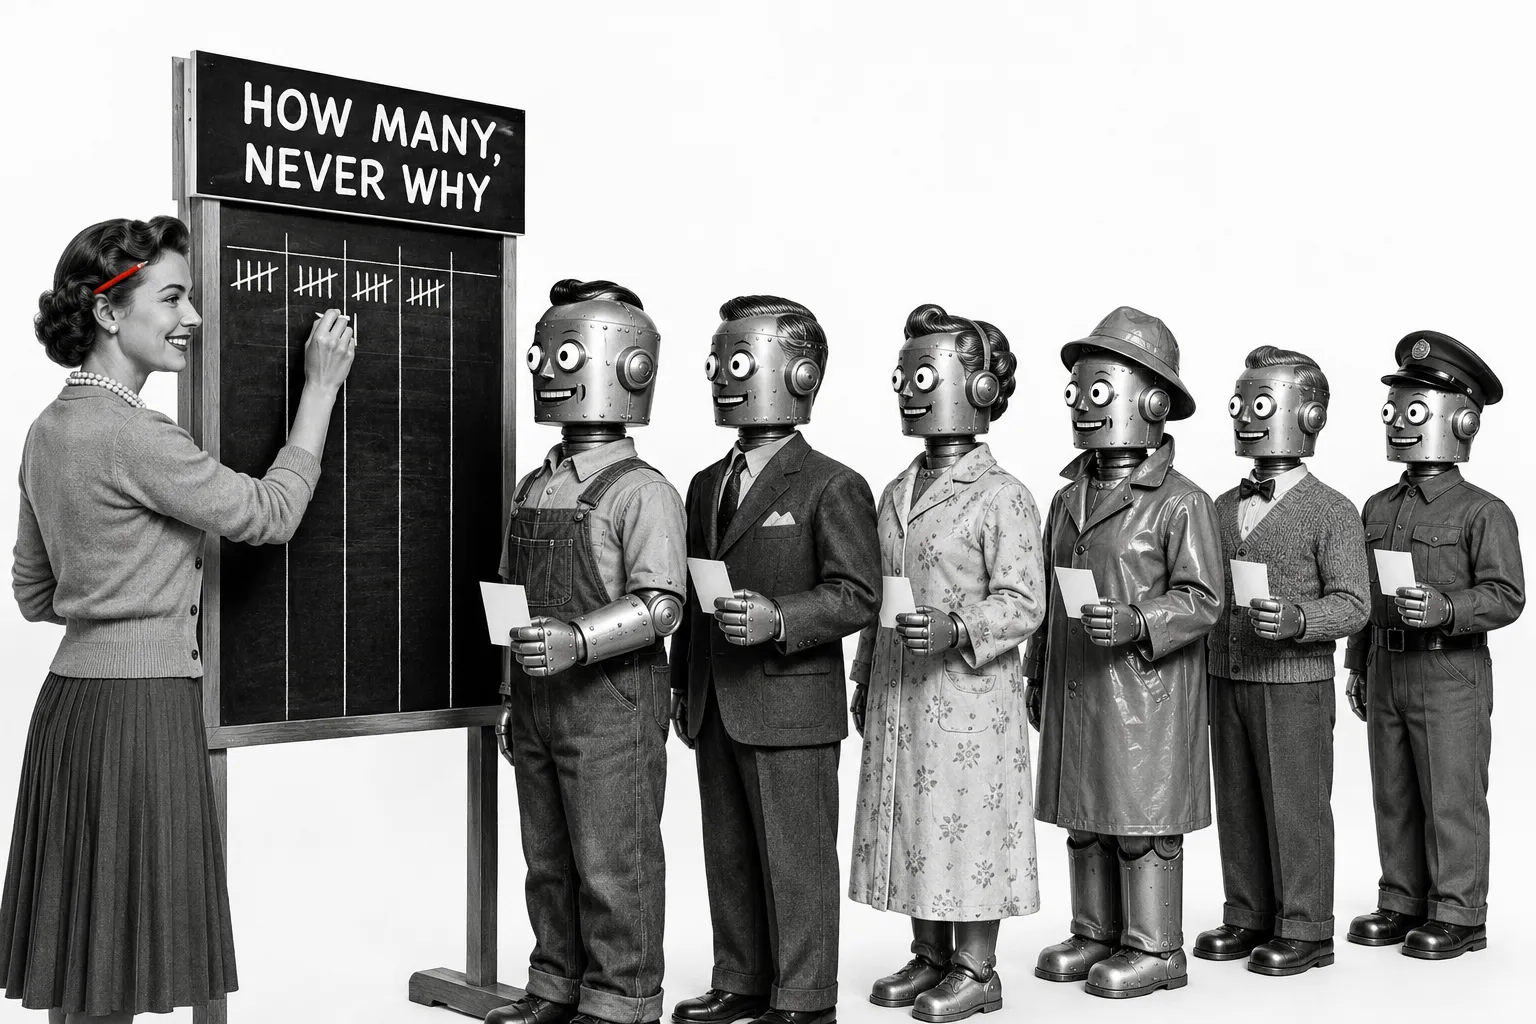
Almost every guide to descriptive research is written for a student about to sit an exam. You get the textbook definition, three methods, a diagram, and an example about measuring pupils’ reading habits. Accurate, and no use at all when you are deciding whether to run 10,000 units of a new product.
So this is descriptive research for people who spend money on the answer. What it is, where it fits against the other kinds of research, the methods that actually earn their keep in commerce, real examples, and the two limits that will bite you if you forget them. Descriptive research is the workhorse of nearly all market research. Most of the studies you have ever commissioned were descriptive, whether anyone called them that or not.
What descriptive research actually is
Descriptive research is a research design whose whole job is to describe the characteristics of a market, a group or a situation as it currently is. It answers what, where, when, how many and how often. It does not answer why, and it does not prove that one thing causes another.
That is the definition, and it holds across every field that uses it. In marketing specifically, descriptive research is “employed to describe the market or respondents’ characteristics”, and it typically produces quantitative information through surveys measuring things like age, income, spending patterns and attitudes (Western Sydney University, Customer Insights). When you field a survey asking customers to rate their satisfaction from one to five, or you pull a report on who buys what and when, you are doing descriptive research.
A quick point that trips people up, because a lot of people search for it directly: descriptive research is usually quantitative, but not always. It is quantitative when you are counting things across a sample, which is most of the time, and the qualitative and quantitative split is worth understanding on its own terms. It is qualitative when the aim is to describe an experience in words rather than numbers, sometimes called descriptive qualitative research. The label follows the data. Do not agonise over it.
Where descriptive research fits: the research triad
Descriptive research makes far more sense once you see it as the middle of three. Marketing research designs fall into three families: exploratory, descriptive and causal (Western Sydney University, Customer Insights). Each answers a different kind of question, and reaching for the wrong one is the expensive mistake, not the method itself.
Exploratory research comes first, when you are in unfamiliar territory and the problem is still fuzzy. It is informal and unstructured: desk research, expert interviews, a few focus groups to work out what is even going on. Exploratory research examples include reading secondary reports before entering a new market, or running open-ended interviews when your checkout conversion drops and you have no idea why. Its output is not a number, it is a better question.
Descriptive research comes next, once you understand the behaviour well enough to ask a precise question. Now you want to measure it across a real sample. How many of our customers are in each age band. What share rate us as satisfied. Which of three concepts scores highest. These are counting questions, and descriptive research is how you count.
Causal research comes last and is the only one that proves cause and effect. It manipulates one variable to see what happens to another, under controlled conditions (Western Sydney University, Customer Insights). A clean A/B test against a representative audience is the everyday version: change the price on one group, hold it on another, and measure the difference in sales. Descriptive research can tell you that customers who buy Product A also buy Product B. Only a causal design can tell you whether A actually drives B, or whether some third thing drives both.
Find the question, size it, prove what moves it. Here is the same idea as a table you can use this afternoon.
| Exploratory | Descriptive | Causal | |
|---|---|---|---|
| The question it answers | What is going on here? | How many, how much, how often? | Does X cause Y? |
| When to use it | The problem is unclear | You can ask a precise question | You need to prove an effect |
| Typical methods | Interviews, focus groups, desk research | Surveys, observation, existing data | Controlled experiments, A/B tests |
| What comes back | Hypotheses and language | Numbers, percentages, profiles | A measured cause-and-effect result |
| What it cannot do | Measure or generalise | Explain why, or prove cause | Explain the human reason behind the effect |
There is a sharper way to tell the three apart than by their method lists, and it is about who is in your sample.
Exploratory research needs interesting people. You are hunting for a hypothesis, so you want the articulate, the extreme, the recent switchers, the ones who will say something you had not thought of. It does not matter in the slightest that they are unrepresentative. Descriptive research needs representative people. Its entire validity rests on the sample looking like the population you are describing, because a description of the wrong people is not a weak answer, it is the wrong answer. Causal research needs randomly assigned people. There, what matters is not that your sample mirrors the market but that the two groups you are comparing differ only in the thing you changed.
Which is why the same 300 respondents can be perfect for one design and useless for another, and why “we surveyed 300 people” tells you nothing on its own. Ask who they were and how they got there.
Descriptive research is the one you will run most often, because most commercial questions are counting questions. It is also the one most often asked to do a job it cannot, which is explain why. Hold that thought.
The methods of descriptive research
Three methods do almost all the work, plus a couple of specialist ones worth knowing.
Surveys are the workhorse. A structured questionnaire put to a sample, using closed questions and rating scales so the answers can be counted and compared. Satisfaction scores, brand awareness, demographic profiles, purchase frequency, attitudes to a concept. Two things decide whether the numbers mean anything: the question wording, because people answer the question you actually wrote rather than the one you meant, and the sample, because a thousand responses from the wrong people are worse than a hundred from the right ones. Volume dressed up as confidence is how bad decisions get made.
Observation gathers data on what people do without asking them, which sidesteps the honesty problem in surveys. Watching how shoppers move through a store, how users navigate a checkout, which shelf position gets the reach. In its more instrumented form it stretches to physiological measures such as eye tracking and heart rate in response to an advert (Western Sydney University, Customer Insights). Observation tells you what happened. It still will not tell you why on its own.
Existing and secondary data is the most underrated method, and the cheapest. Your own analytics, sales records, returns data, published market reports, industry benchmarks. Describing your market from data you already hold is descriptive research, and most brands are sitting on more of it than they use. If you want to describe who your customers are and what they buy, start here before you field a single survey.
Two more count as descriptive when the aim is to describe rather than explain. Case studies are an in-depth account of a single subject, useful for texture but never for generalising, because one case is not a sample. And capturing the customer’s own language at scale is a discipline of its own, closer to the qualitative end of descriptive work, which is what voice of customer tools are built to organise.
Cross-sectional or longitudinal: the two shapes
Every descriptive study is one of two shapes, and the distinction matters more than it sounds.
A cross-sectional study is a snapshot: one sample, measured at a single point in time. A satisfaction survey fielded this March, a brand awareness study run once before a launch. It is quick, cheap and answers “what does this look like right now”.
A longitudinal study measures the same thing repeatedly over time, so you can see change (Western Sydney University, Customer Insights). This is what brand tracking is: the same questions to a fresh sample every quarter, so you can tell whether awareness is climbing or your last campaign moved anything. A snapshot cannot tell you about direction. If the question is “has it changed”, you need the longitudinal version, and you need to decide that before you field the first wave, not after.
The practical rule: use cross-sectional when you need a profile now, longitudinal when the whole point is the trend.
Descriptive research examples that aren’t about students
Here are the ones you will actually recognise from running a brand.
A brand awareness survey. You field a survey to a representative sample and ask, unprompted and then prompted, which brands in your category they can name. The output is a set of percentages: X per cent name you unprompted, Y per cent recognise you when shown the logo, and measuring it properly is a discipline of its own. Pure description. It tells you where you stand, not why, and not whether your last ad caused the number.
A customer satisfaction study. The classic one-to-five scale, or an NPS question, put to your buyers. You get a distribution and an average you can track over time. Cross-sectional if you run it once, longitudinal if you run it every quarter.
Market sizing and segmentation. A survey plus existing data to describe how big the market is and how it splits: by age, by need, by spend. You are drawing a map of what is there, which is descriptive by definition.
A concept test. You put three product concepts in front of a representative sample and measure which scores highest on appeal and purchase intent. That ranking is descriptive research, and it is why a concept test needs a real sample rather than a focus group, because you cannot count a room of eight people.
A pricing survey. Asking a structured set of questions to describe how demand changes at different price points, using a method such as Gabor-Granger. It describes stated willingness to pay across a sample. It does not prove what people will do at the till, which is the first of the two limits below.
And the canonical example, if you want the textbook one: a national census. A government counting its population by age, household and income, describing the country as it is on one day, explaining nothing. That is descriptive research in its purest form.
The two limits that will bite you
Descriptive research is genuinely useful, and it has two limits that matter enough to state plainly.
It describes, it does not explain. This is the one people forget under pressure. Descriptive research can show you that satisfaction fell and that returns rose in the same quarter. It cannot tell you that one caused the other, or what caused either. The moment you start reading cause into a descriptive result, you have quietly switched to a claim your method cannot support. If the decision hinges on why, you need exploratory work to find the reason or a causal test to prove it. Description is where you start, not where you settle a cause-and-effect question.
It mostly records what people say, and saying is a weak guide to doing. A survey captures stated attitudes and intentions, and the gap between those and real behaviour is one of the most reliable findings in behavioural science. A meta-analysis of experiments that successfully shifted people’s intentions found that a medium-to-large change in intention produced only a small-to-medium change in actual behaviour (Sheeran and Webb, 2016). People genuinely intend to buy the sustainable option, eat better and spend more with brands they admire, and then routinely do not. A descriptive survey that says forty per cent prefer option B is a real signal, but it is not a sales forecast.
Add to that: a cross-sectional study is a single moment. Tastes move, competitors launch, the season turns. Treat any one-off descriptive result as a photograph, not a law.
None of this makes descriptive research weak. It makes it directional. Used for what it is good at, describing what is, it is the most efficient tool in the box. Asked to explain or predict on its own, it will let you down at the worst moment.
The one move that gets you closer to why
Descriptive research cannot prove a cause. There is one move that gets you meaningfully closer, though, and it is the most underused thing in the whole method: cut the result by subgroup.
A headline average is almost always the least useful form of a descriptive finding. “Satisfaction fell four points this quarter” gives you nothing to do on Monday. Cross-tabulate the same data by customer type, order value, device, acquisition channel and tenure, and the fall often turns out not to be spread at all. Satisfaction held everywhere except among first-time buyers on mobile, where it dropped fifteen points. That is still description, and it still proves nothing about cause. But it has localised the problem to somewhere you can go and look, which turns a number into a brief.
The discipline is deciding your cuts before you field rather than after. You cannot retrofit a subgroup you did not sample for, and every cut you want to read on its own needs enough people in it to be readable, with roughly a hundred per cell as the usual working minimum. Two cuts of three groups each is six cells, which is a very different sample requirement from one headline number. The arithmetic behind that is worth doing on paper before you spend, because working it out afterwards is how trackers end up with subgroups too thin to say anything.
How to use it well before a launch
The honest way to run descriptive research is to know exactly what job it is doing in the decision. Early on, when a decision is cheap and reversible, a descriptive survey that says people like a concept is plenty to act on. When you are about to commit real money, a production run or a launch, stated preference alone is not enough, and you want signal that sits closer to behaviour.
This is the step where a pre-launch test earns its place. You put the concept, the pack, the ad or the in-context price in front of an audience and get back a read on purchase intent, the reasons behind it in shoppers’ own words, and a clear next move, in days rather than weeks. That is what TestFeed is built to give you: a directional, pre-spend read on which version to back and why, before you commit to the run. It is descriptive research doing its proper job, measuring stated intent across an audience so you go into the expensive decision with better odds. It does not replace a full in-market test on the call that carries the most money, and it is better for being honest about that. It is signal to narrow the bet, not a guarantee.
Where AI fits now
The newest way to run the front of a descriptive study is with AI: synthetic respondents and modelled audiences that predict a likely reaction instead of fielding a live one. Used well, they let you screen more concepts before you spend on a full study. Used badly, they become a confident number with nobody behind it. The rule does not change with the technology: this is pre-spend signal to narrow your options, not a market forecast, and the highest-stakes decisions still deserve real behaviour before you commit.
Frequently asked questions
What is descriptive research?
Descriptive research is a research design whose job is to describe the characteristics of a market, group or situation as it is. It answers what, where, when, how many and how often, using methods such as surveys, observation and existing data. It does not explain why something happens or prove cause and effect.
Is descriptive research qualitative or quantitative?
Usually quantitative, because most descriptive studies count things across a sample: age groups, income, satisfaction scores, purchase frequency. It can be qualitative when the aim is to describe an experience in words rather than numbers, which is sometimes called descriptive qualitative research. The label follows the data, not the other way round.
What is the difference between exploratory, descriptive and causal research?
Exploratory research is used early, when the problem is still unclear, to find the right question. Descriptive research measures and describes that question across a sample once you understand it well enough to ask precisely. Causal research runs a controlled experiment to prove that changing one thing moves another. Find the question, size it, then prove what drives it.
What are the main methods of descriptive research?
The three most common are surveys with closed questions, systematic observation of behaviour, and analysis of existing or secondary data such as sales records and analytics. Case studies and physiological measures also count. Surveys do most of the work in commercial market research.
How many people do you need for descriptive research?
It depends on how finely you plan to cut the results, not just on the headline number. A single overall percentage from a few hundred representative responses is readable, but every subgroup you want to report on its own needs roughly a hundred people in it, so two cuts of three groups each is six cells rather than one. Decide those cuts before you field, because you cannot retrofit a subgroup you did not sample for. Who is in the sample matters more than how many: descriptive research is only as good as how well the sample represents the population you are describing.
What are the limitations of descriptive research?
It describes but does not explain, so it cannot tell you why a number is what it is or prove cause and effect. It usually records what people say, which is a weak guide to what they do, and it captures a single moment unless you repeat it. Treat the result as directional signal and back expensive decisions with real behaviour.
The short version
Descriptive research describes what your market looks like and what it does: the counts, the shares, the profiles, the trends. It is the middle of the triad, the workhorse you will reach for most, and it does its job well as long as you remember the two things it cannot do. It cannot tell you why, and it cannot promise that what people say maps to what they will pay for. Name the decision first, use descriptive research to size it, lean on causal work and real behaviour when the money on the table justifies it, and treat every result as signal that narrows the odds rather than settling them. Get that right and you spend the least to reach the most confident call, which is the whole point of doing research at all.